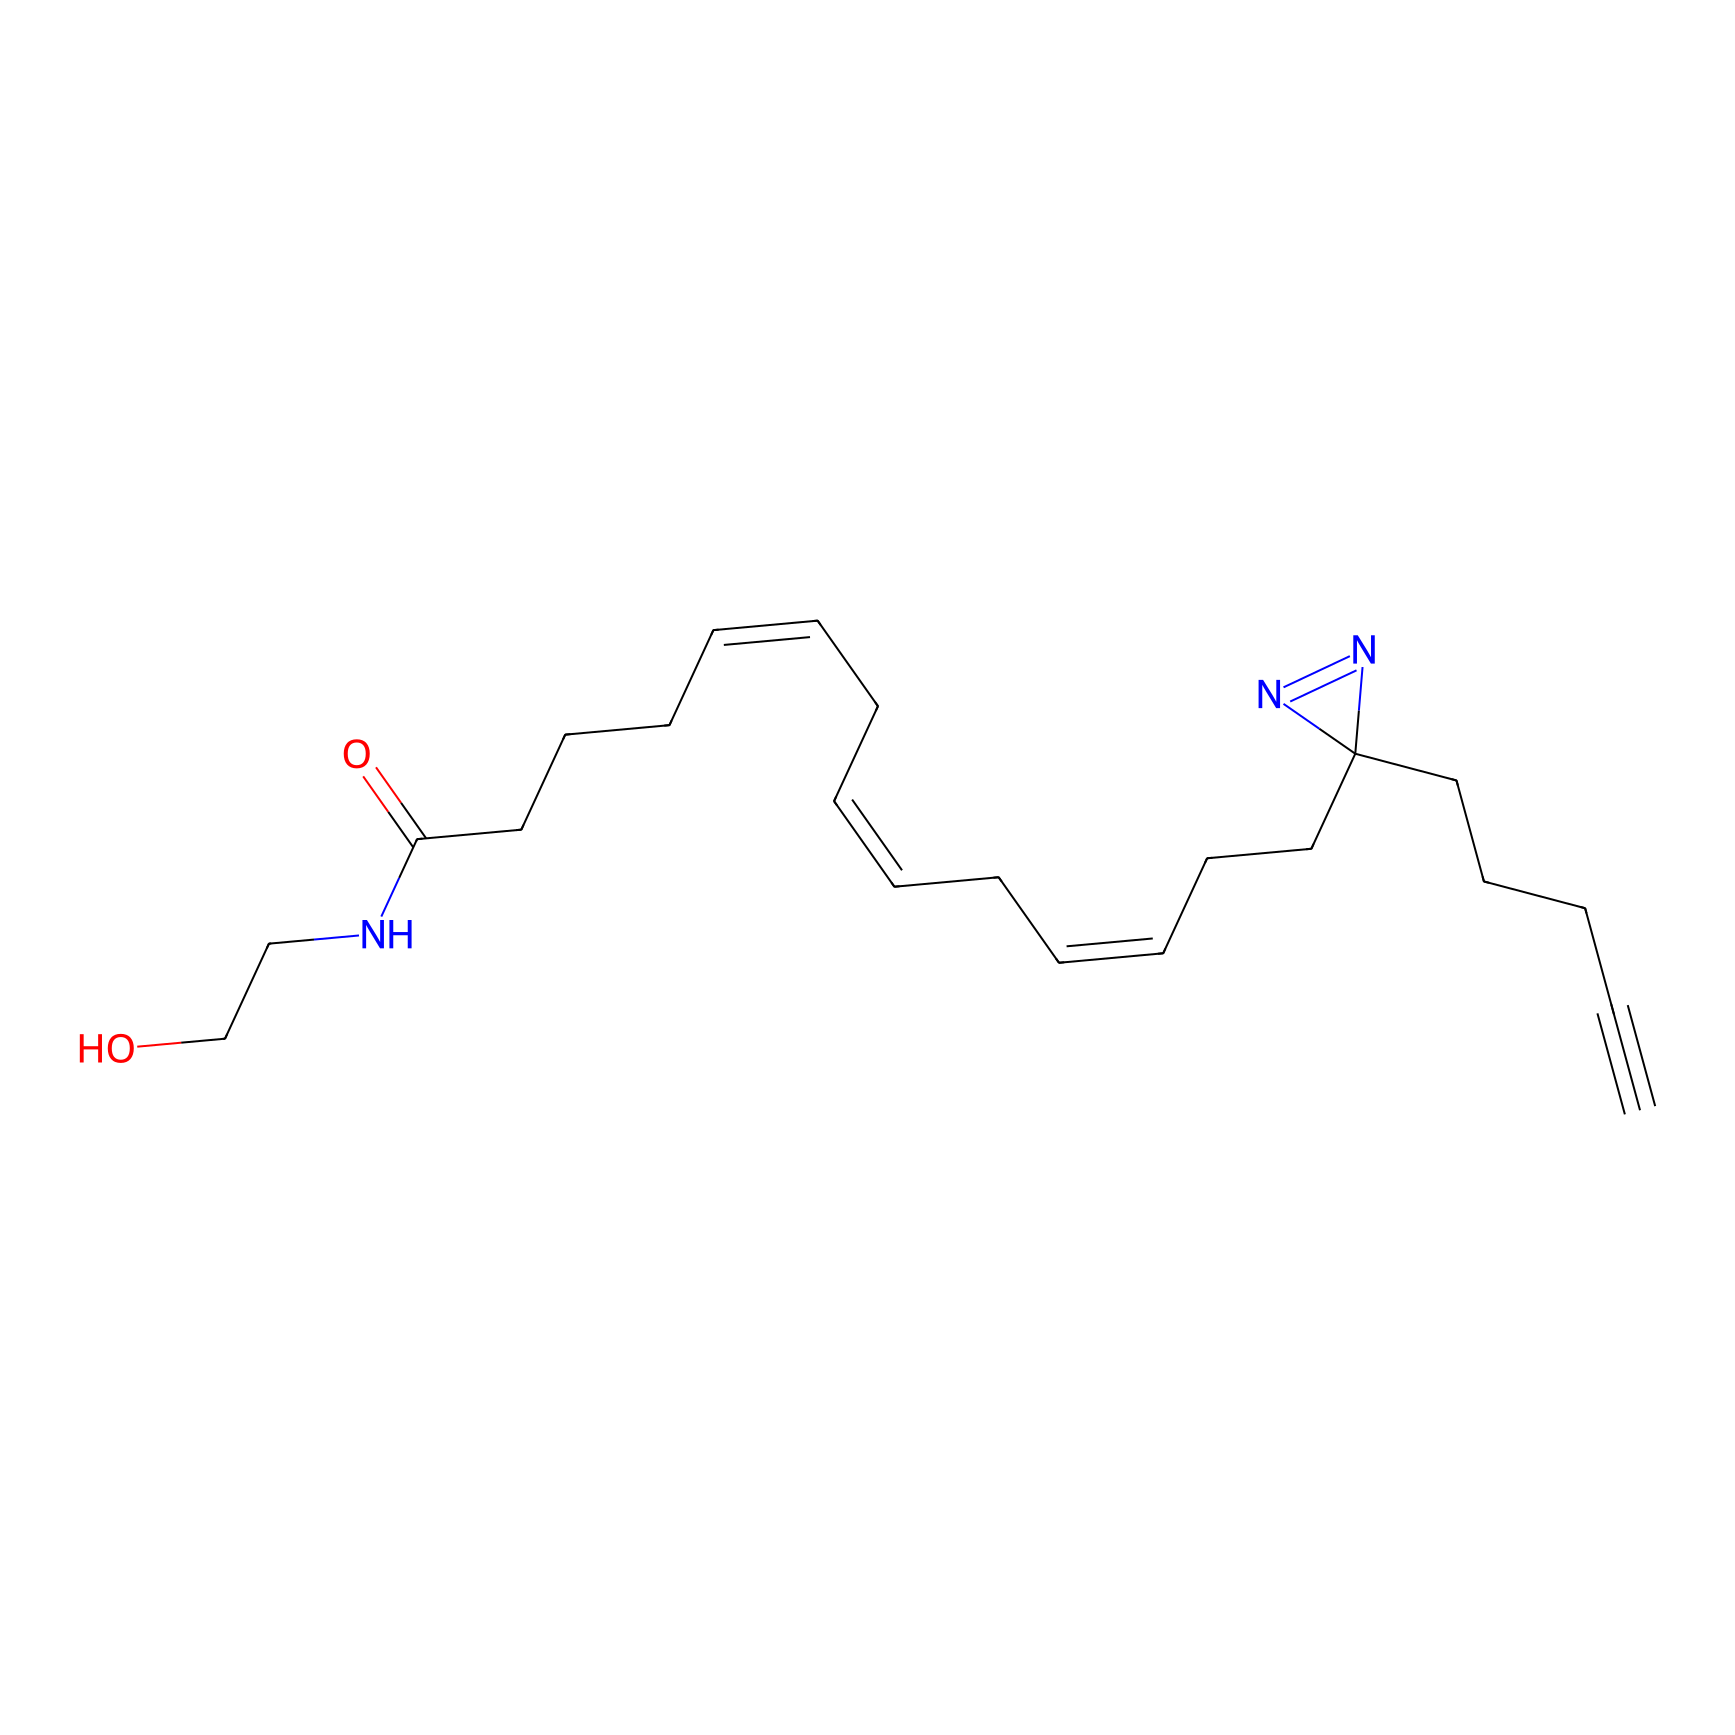
General Information of Probe

Probe ID
LDPC0120
Probe Name
AEA-DA
Synonyms
SCHEMBL18092603
Probe Type
PAL-AfBPP Probe
Structure
2D MOL
Ro5 Violations (Lipinski): 1 Molecular Weight (mw) 371.5
Lipid-water partition coefficient (xlogp) 3.8
Rotatable Bond Count (rotbonds) 16
Hydrogen Bond Donor Count (hbonddonor) 2
Hydrogen Bond Acceptor Count (hbondacc) 4
Chemical Identifiers
Formula
C22H33N3O2
IUPAC Name
(5Z,8Z,11Z)-N-(2-hydroxyethyl)-14-(3-pent-4-ynyldiazirin-3-yl)tetradeca-5,8,11-trienamide
Canonical SMILES
C#CCCCC1(N=N1)CCC=CCC=CCC=CCCCC(=O)NCCO
InChI
InChI=1S/C22H33N3O2/c1-2-3-14-17-22(24-25-22)18-15-12-10-8-6-4-5-7-9-11-13-16-21(27)23-19-20-26/h1,4,6-7,9-10,12,26H,3,5,8,11,13-20H2,(H,23,27)/b6-4-,9-7-,12-10-
InChIKey
UNCWIXRHQUPOCJ-PTKMVDJPSA-N

The Probe Interaction Atlas

Target(s) List of this Probe

23 Enzyme Labeled by This Probe
Target Name Target ID Binding Site(Ratio) Interaction ID
1-acylglycerol-3-phosphate O-acyltransferase ABHD5 (ABHD5) LDTP09542 15.76  LDD0333 
Aldehyde dehydrogenase 1A1 (ALDH1A1) LDTP01767 7.55  LDD0146 
Aldo-keto reductase family 1 member C1 (AKR1C1) LDTP05436 9.33  LDD0146 
Aldo-keto reductase family 1 member C2 (AKR1C2) LDTP04543 9.20  LDD0146 
Aldo-keto reductase family 1 member C3 (AKR1C3) LDTP03976 6.02  LDD0146 
ATP-dependent translocase ABCB1 (ABCB1) LDTP02254 4.20  LDD0334 
Bifunctional epoxide hydrolase 2 (EPHX2) LDTP03692 20.00  LDD0146 
Carnitine O-palmitoyltransferase 2, mitochondrial (CPT2) LDTP03257 2.31  LDD0146 
Ceramide synthase 2 (CERS2) LDTP10329 4.99  LDD0333 
Cytochrome P450 4F12 (CYP4F12) LDTP12267 2.42  LDD0146 
Dehydrogenase/reductase SDR family member 1 (DHRS1) LDTP10550 20.00  LDD0146 
Ferrochelatase, mitochondrial (FECH) LDTP03198 13.73  LDD0146 
Lipid droplet-associated hydrolase (LDAH) LDTP16007 3.14  LDD0333 
Nicotinamide phosphoribosyltransferase (NAMPT) LDTP04051 20.00  LDD0146 
Palmitoyl-protein thioesterase ABHD10, mitochondrial (ABHD10) LDTP12628 11.68  LDD0333 
Prolyl endopeptidase-like (PREPL) LDTP06849 4.67  LDD0333 
Prostaglandin reductase 2 (PTGR2) LDTP08979 5.15  LDD0146 
Retinal dehydrogenase 2 (ALDH1A2) LDTP01419 3.29  LDD0333 
S-methyl-5'-thioadenosine phosphorylase (MTAP) LDTP05758 7.83  LDD0333 
Saccharopine dehydrogenase-like oxidoreductase (SCCPDH) LDTP15484 8.09  LDD0146 
Serum paraoxonase/arylesterase 2 (PON2) LDTP06333 2.92  LDD0146 
Sterol O-acyltransferase 1 (SOAT1) LDTP03769 3.74  LDD0333 
Thiol S-methyltransferase TMT1A (TMT1A) LDTP12056 8.40  LDD0333 
------------------------------------------------------------------------------------
⏷ Show the Full List of 23 Enzyme
2 Transporter and channel Labeled by This Probe
Target Name Target ID Binding Site(Ratio) Interaction ID
ATP synthase subunit g, mitochondrial (ATP5MG) LDTP14511 3.13  LDD0334 
Scavenger receptor class B member 1 (SCARB1) LDTP09547 3.54  LDD0334 
------------------------------------------------------------------------------------
2 Other Labeled by This Probe
Target Name Target ID Binding Site(Ratio) Interaction ID
Brain-specific angiogenesis inhibitor 1-associated protein 2 (BAIAP2) LDTP13755 20.00  LDD0337 
Mediator of RNA polymerase II transcription subunit 25 (MED25) LDTP07906 5.18  LDD0333 
------------------------------------------------------------------------------------

Competitor(s) Related To This Probe

Competitor ID Name Concentration Cell-system Ref
 LDCM0082  FK866 25 uM Human lung adenocarcinoma cells (A-549) [2]
 LDCM0136  SR-4559 25 uM Human normal cells (HEK-293T) [1]
 LDCM0137  SR-4995 25 uM Human normal cells (HEK-293T) [1]
 LDCM0138  KDT501 50 uM Human normal cells (HEK-293T) [1]

Full Information of The Labelling Profiles of This Probe

Quantification: Probe vs (Probe+Competitor)
  
Experiment 1 Reporting the Labelling Profiles of This Probe
REF [2]
Probe concentration
5 uM
Quantitative Method
SILAC
Competitor Name
FK866
Competitor Concentration
25 uM
In Vitro Experiment Model
Model Type
Living cell
Derived Tissue
Lung
Disease Model
Lung adenocarcinoma [ICD-11:2C25]
Model Name
Human lung adenocarcinoma cells (A-549)
Interaction Atlas ID
  
Experiment 2 Reporting the Labelling Profiles of This Probe
REF [1]
Probe concentration
10 uM
Quantitative Method
SILAC
Competitor Name
SR-4559
Competitor Concentration
25 uM
In Vitro Experiment Model
Model Type
Living cell
Derived Tissue
Peripheral blood
Disease Model
Normal
Model Name
Human normal cells (HEK-293T)
Interaction Atlas ID
  
Experiment 3 Reporting the Labelling Profiles of This Probe
REF [1]
Probe concentration
10 uM
Quantitative Method
SILAC
Competitor Name
SR-4995
Competitor Concentration
25 uM
In Vitro Experiment Model
Model Type
Living cell
Derived Tissue
Peripheral blood
Disease Model
Normal
Model Name
Human normal cells (HEK-293T)
Interaction Atlas ID
  
Experiment 4 Reporting the Labelling Profiles of This Probe
REF [1]
Probe concentration
10 uM
Quantitative Method
SILAC
Competitor Name
KDT501
Competitor Concentration
25 uM
In Vitro Experiment Model
Model Type
Living cell
Derived Tissue
Peripheral blood
Disease Model
Normal
Model Name
Human normal cells (HEK-293T)
Interaction Atlas ID
  
Experiment 5 Reporting the Labelling Profiles of This Probe
REF [1]
Probe concentration
10 uM
Quantitative Method
SILAC
Competitor Name
KDT501
Competitor Concentration
50 uM
In Vitro Experiment Model
Model Type
Living cell
Derived Tissue
Peripheral blood
Disease Model
Normal
Model Name
Human normal cells (HEK-293T)
Interaction Atlas ID

References

1 Mapping Protein Targets of Bioactive Small Molecules Using Lipid-Based Chemical Proteomics. ACS Chem Biol. 2017 Oct 20;12(10):2671-2681. doi: 10.1021/acschembio.7b00581. Epub 2017 Sep 20.
Mass spectrometry data entry: PXD007570
2 A Global Map of Lipid-Binding Proteins and Their Ligandability in Cells. Cell. 2015 Jun 18;161(7):1668-80. doi: 10.1016/j.cell.2015.05.045.