Details of the Competitor
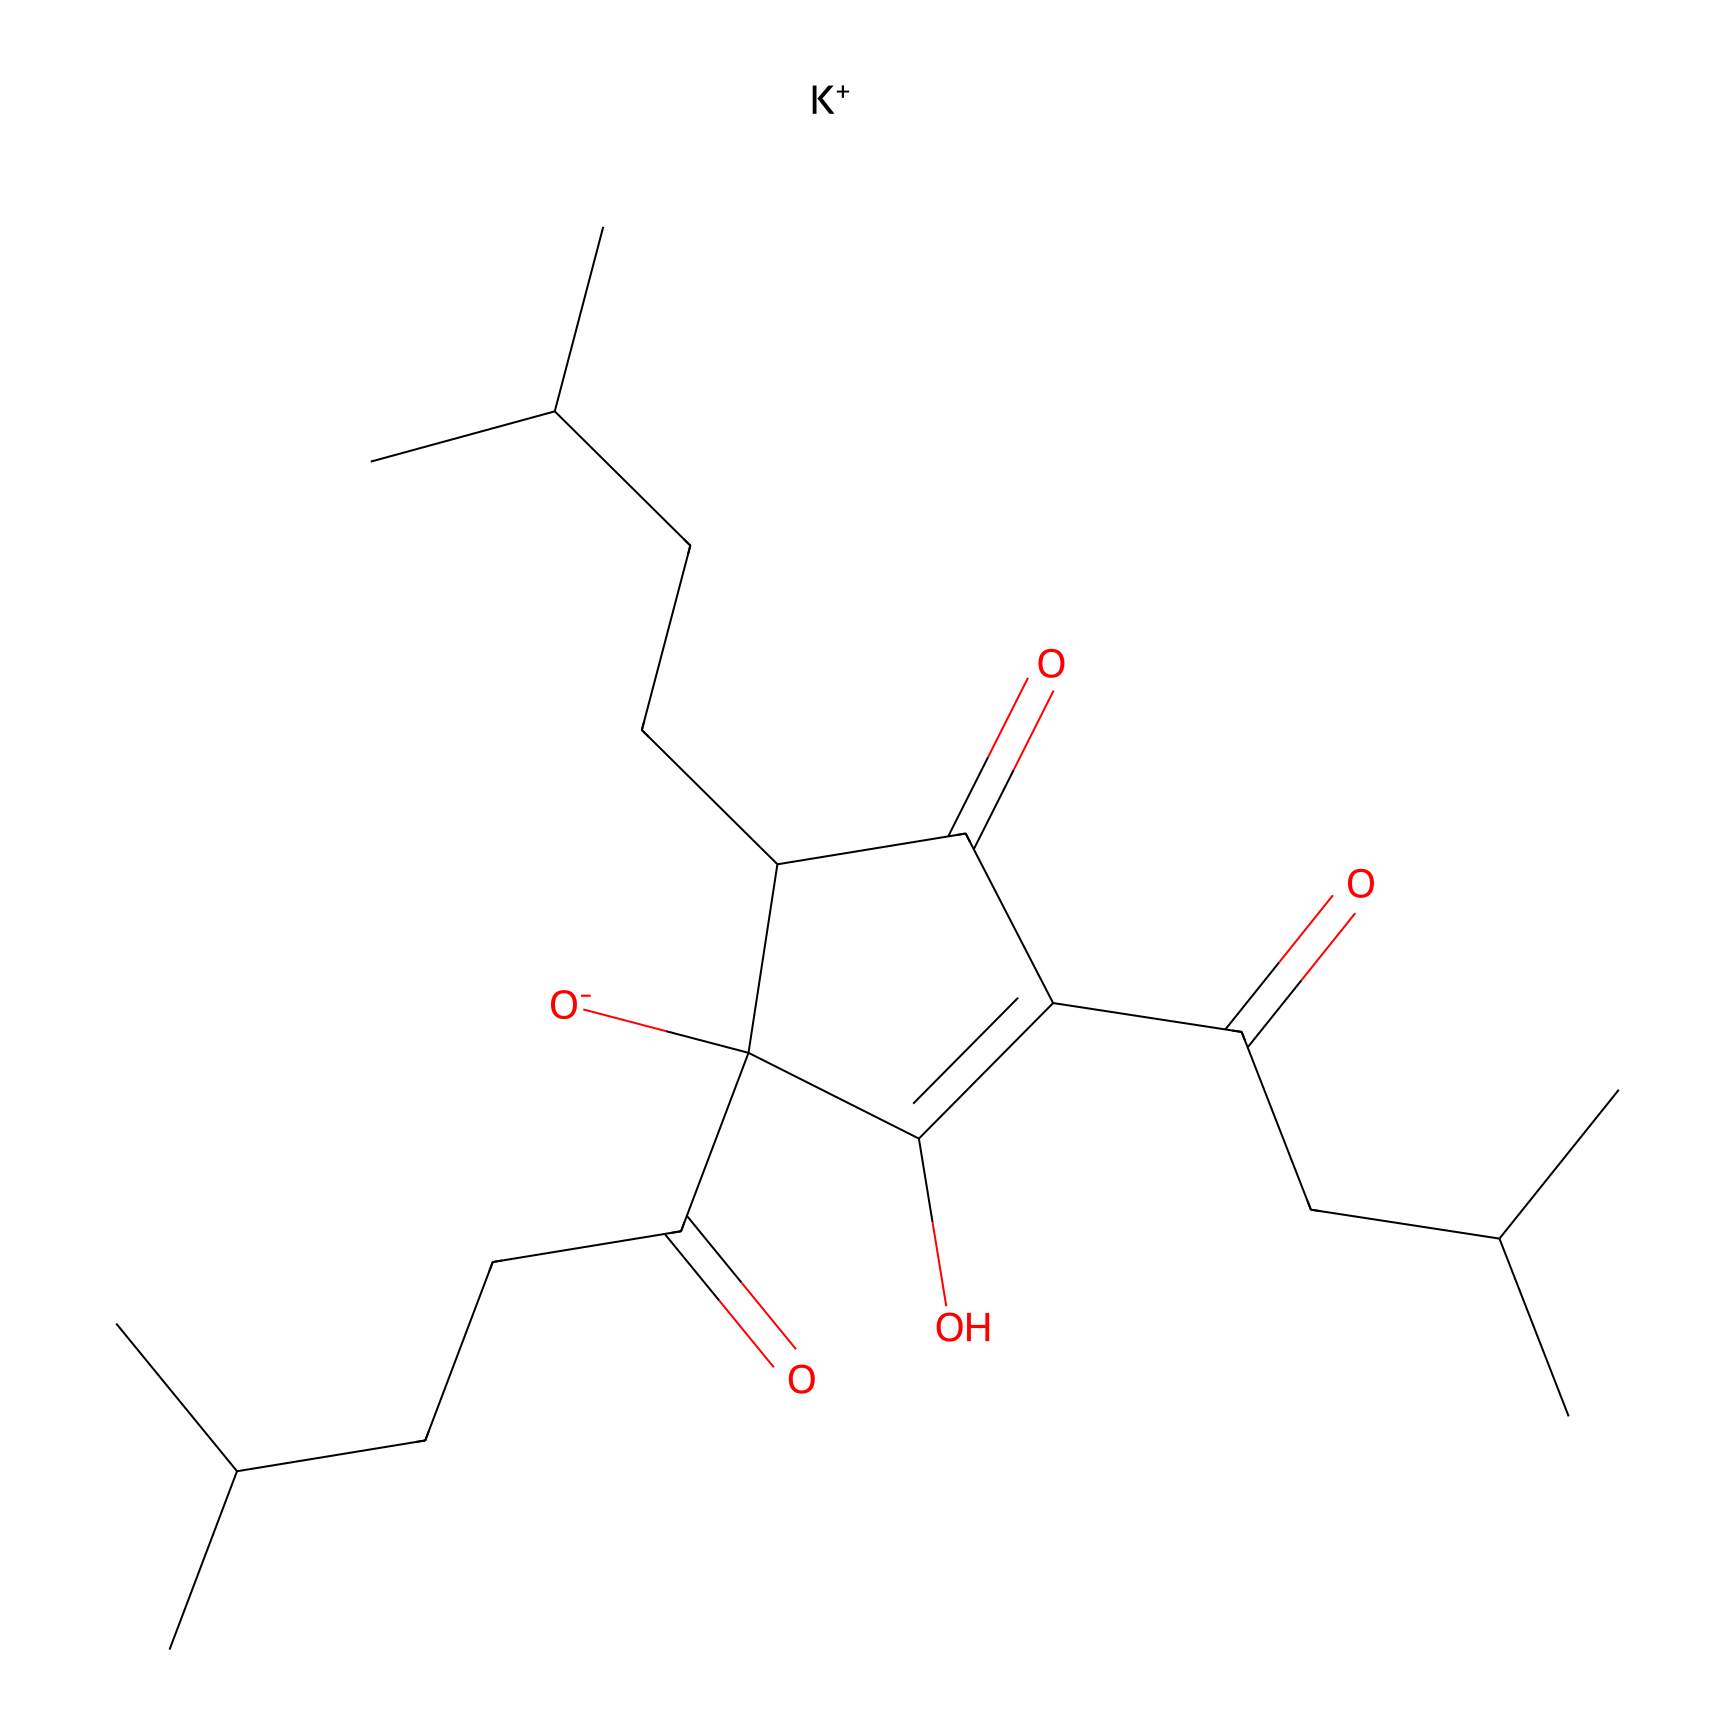
General Information of Competitor
The Competitor Interaction Atlas
Probe(s) Related This Competitor
PAL-AfBPP Probe
| Probe Name | Structure | Concentration | Cell-system | Ref | |
|---|---|---|---|---|---|
|
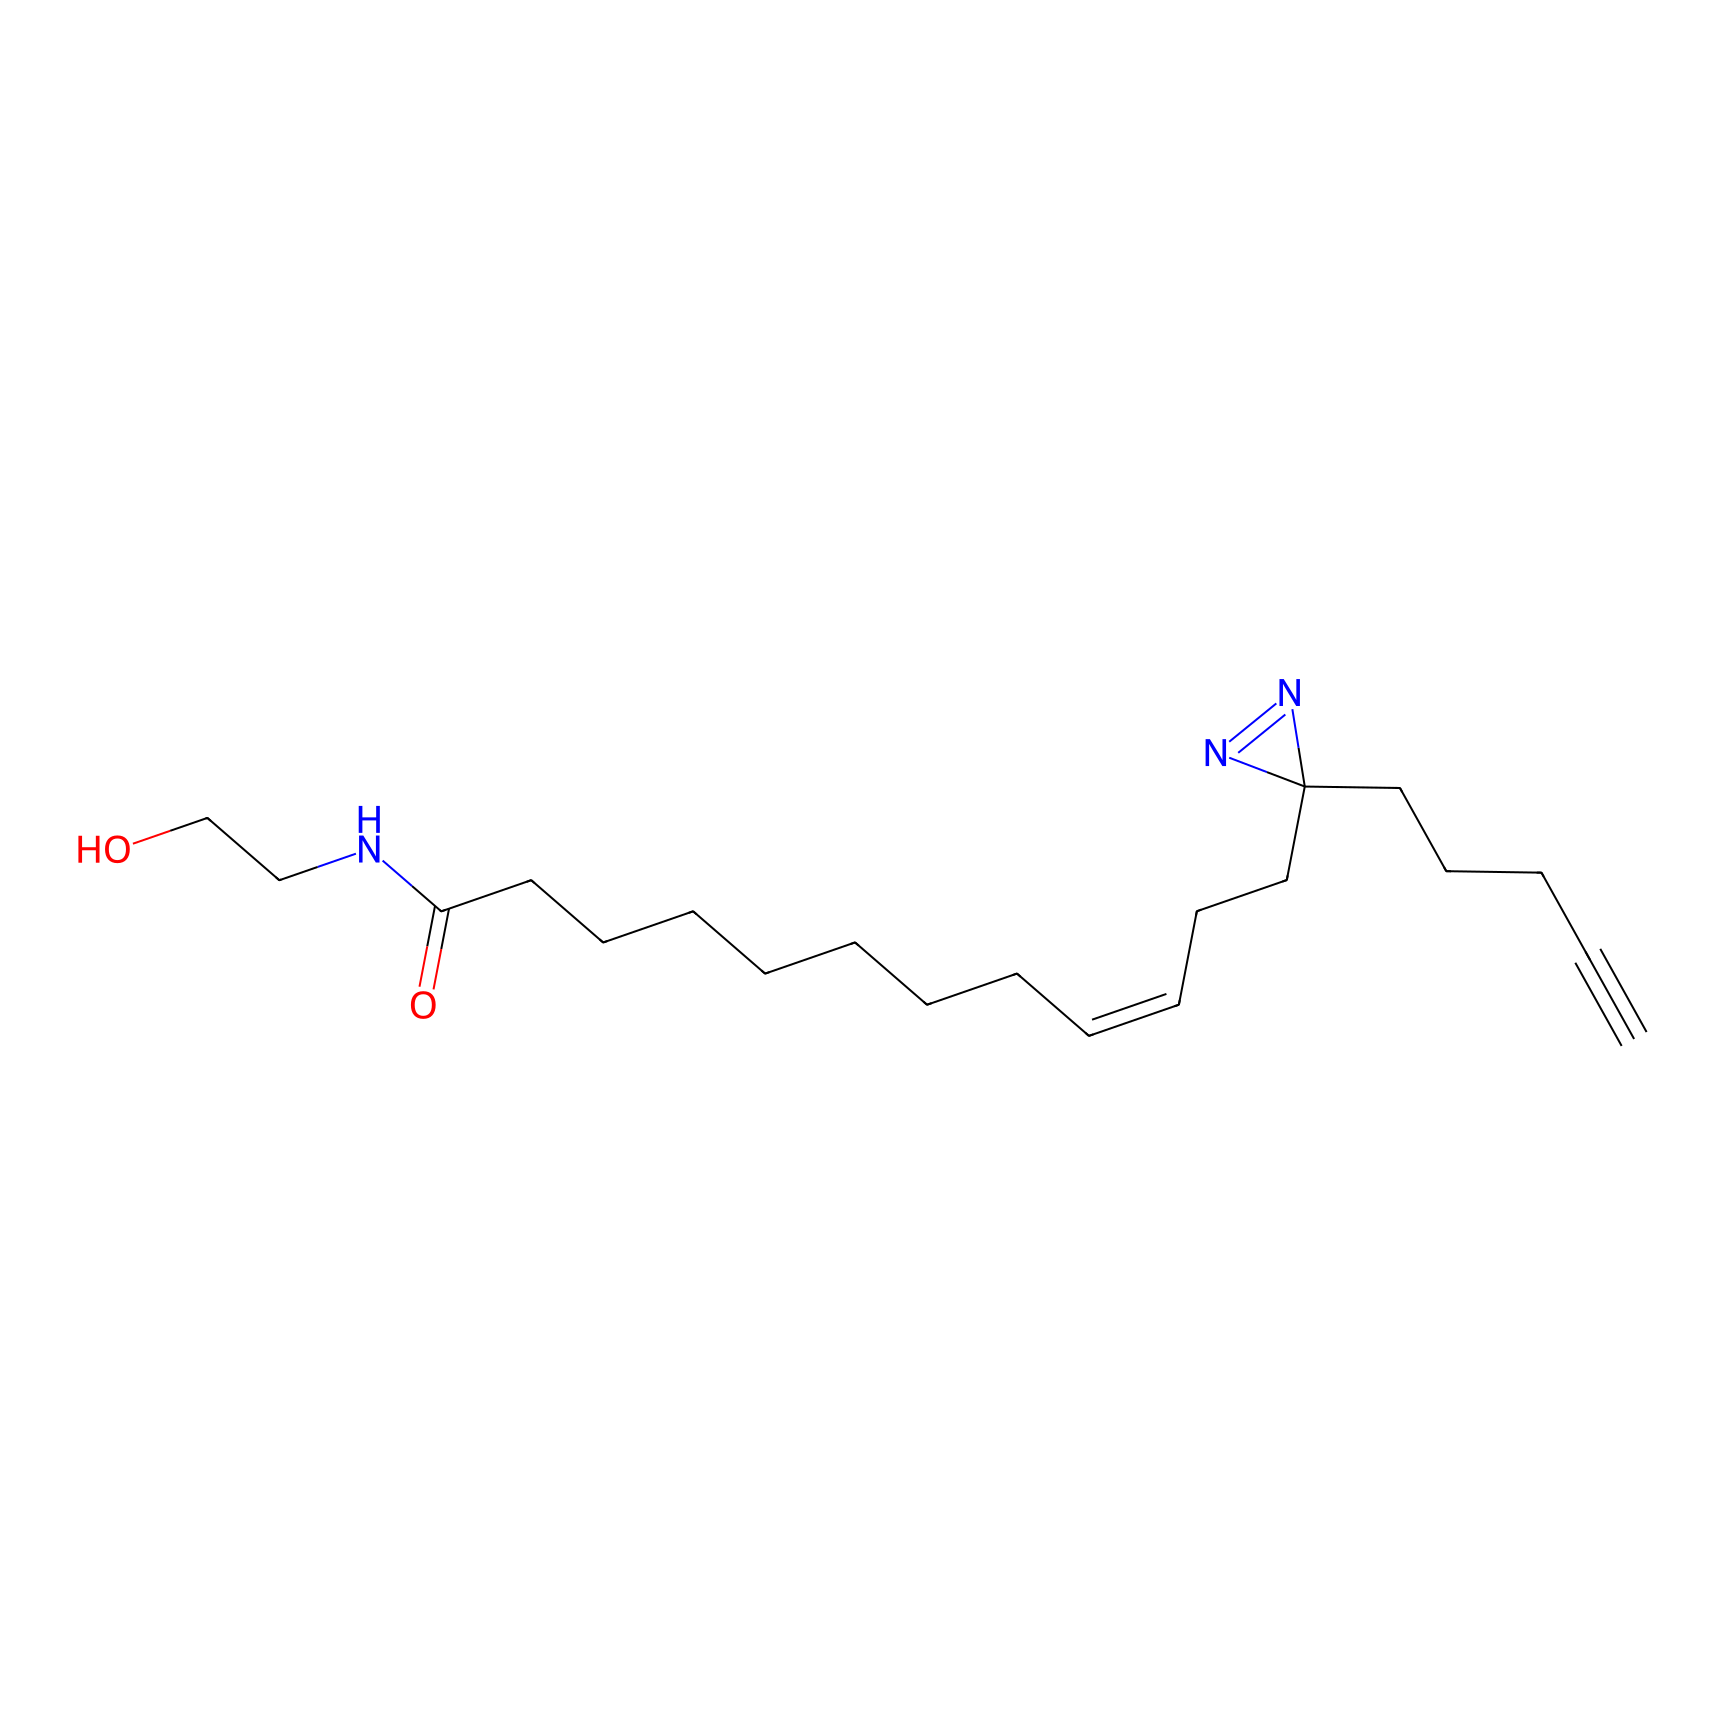
OEA-DA Probe Info |
 |
10 uM | Human normal cells (HEK-293T) | [1] | |
|
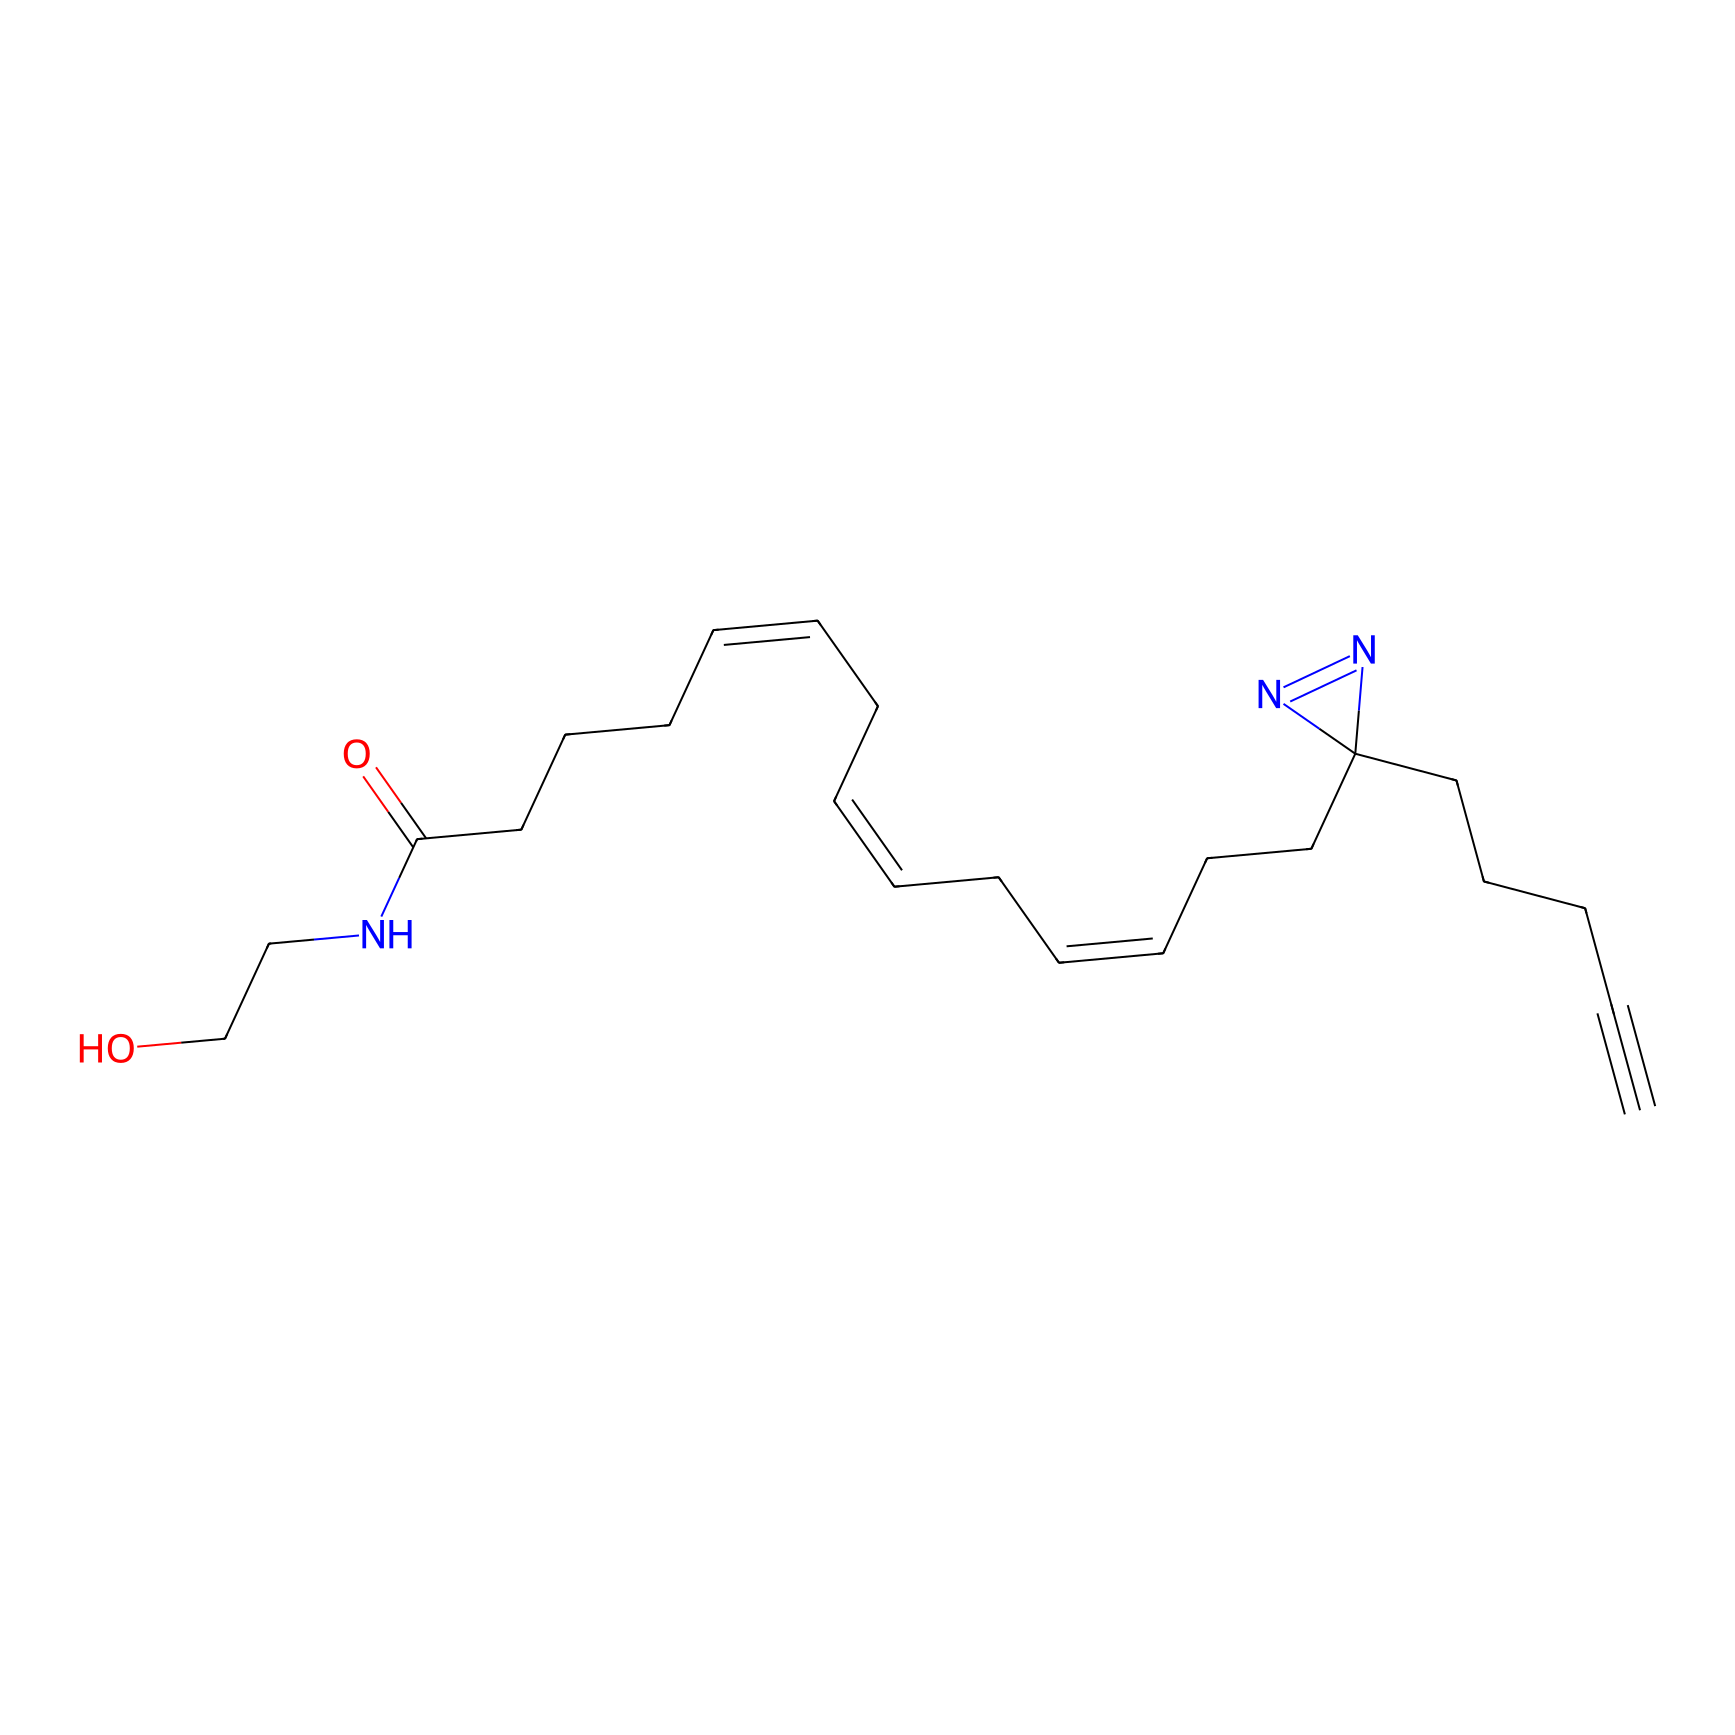
AEA-DA Probe Info |
 |
10 uM | Human normal cells (HEK-293T) | [1] | |
|
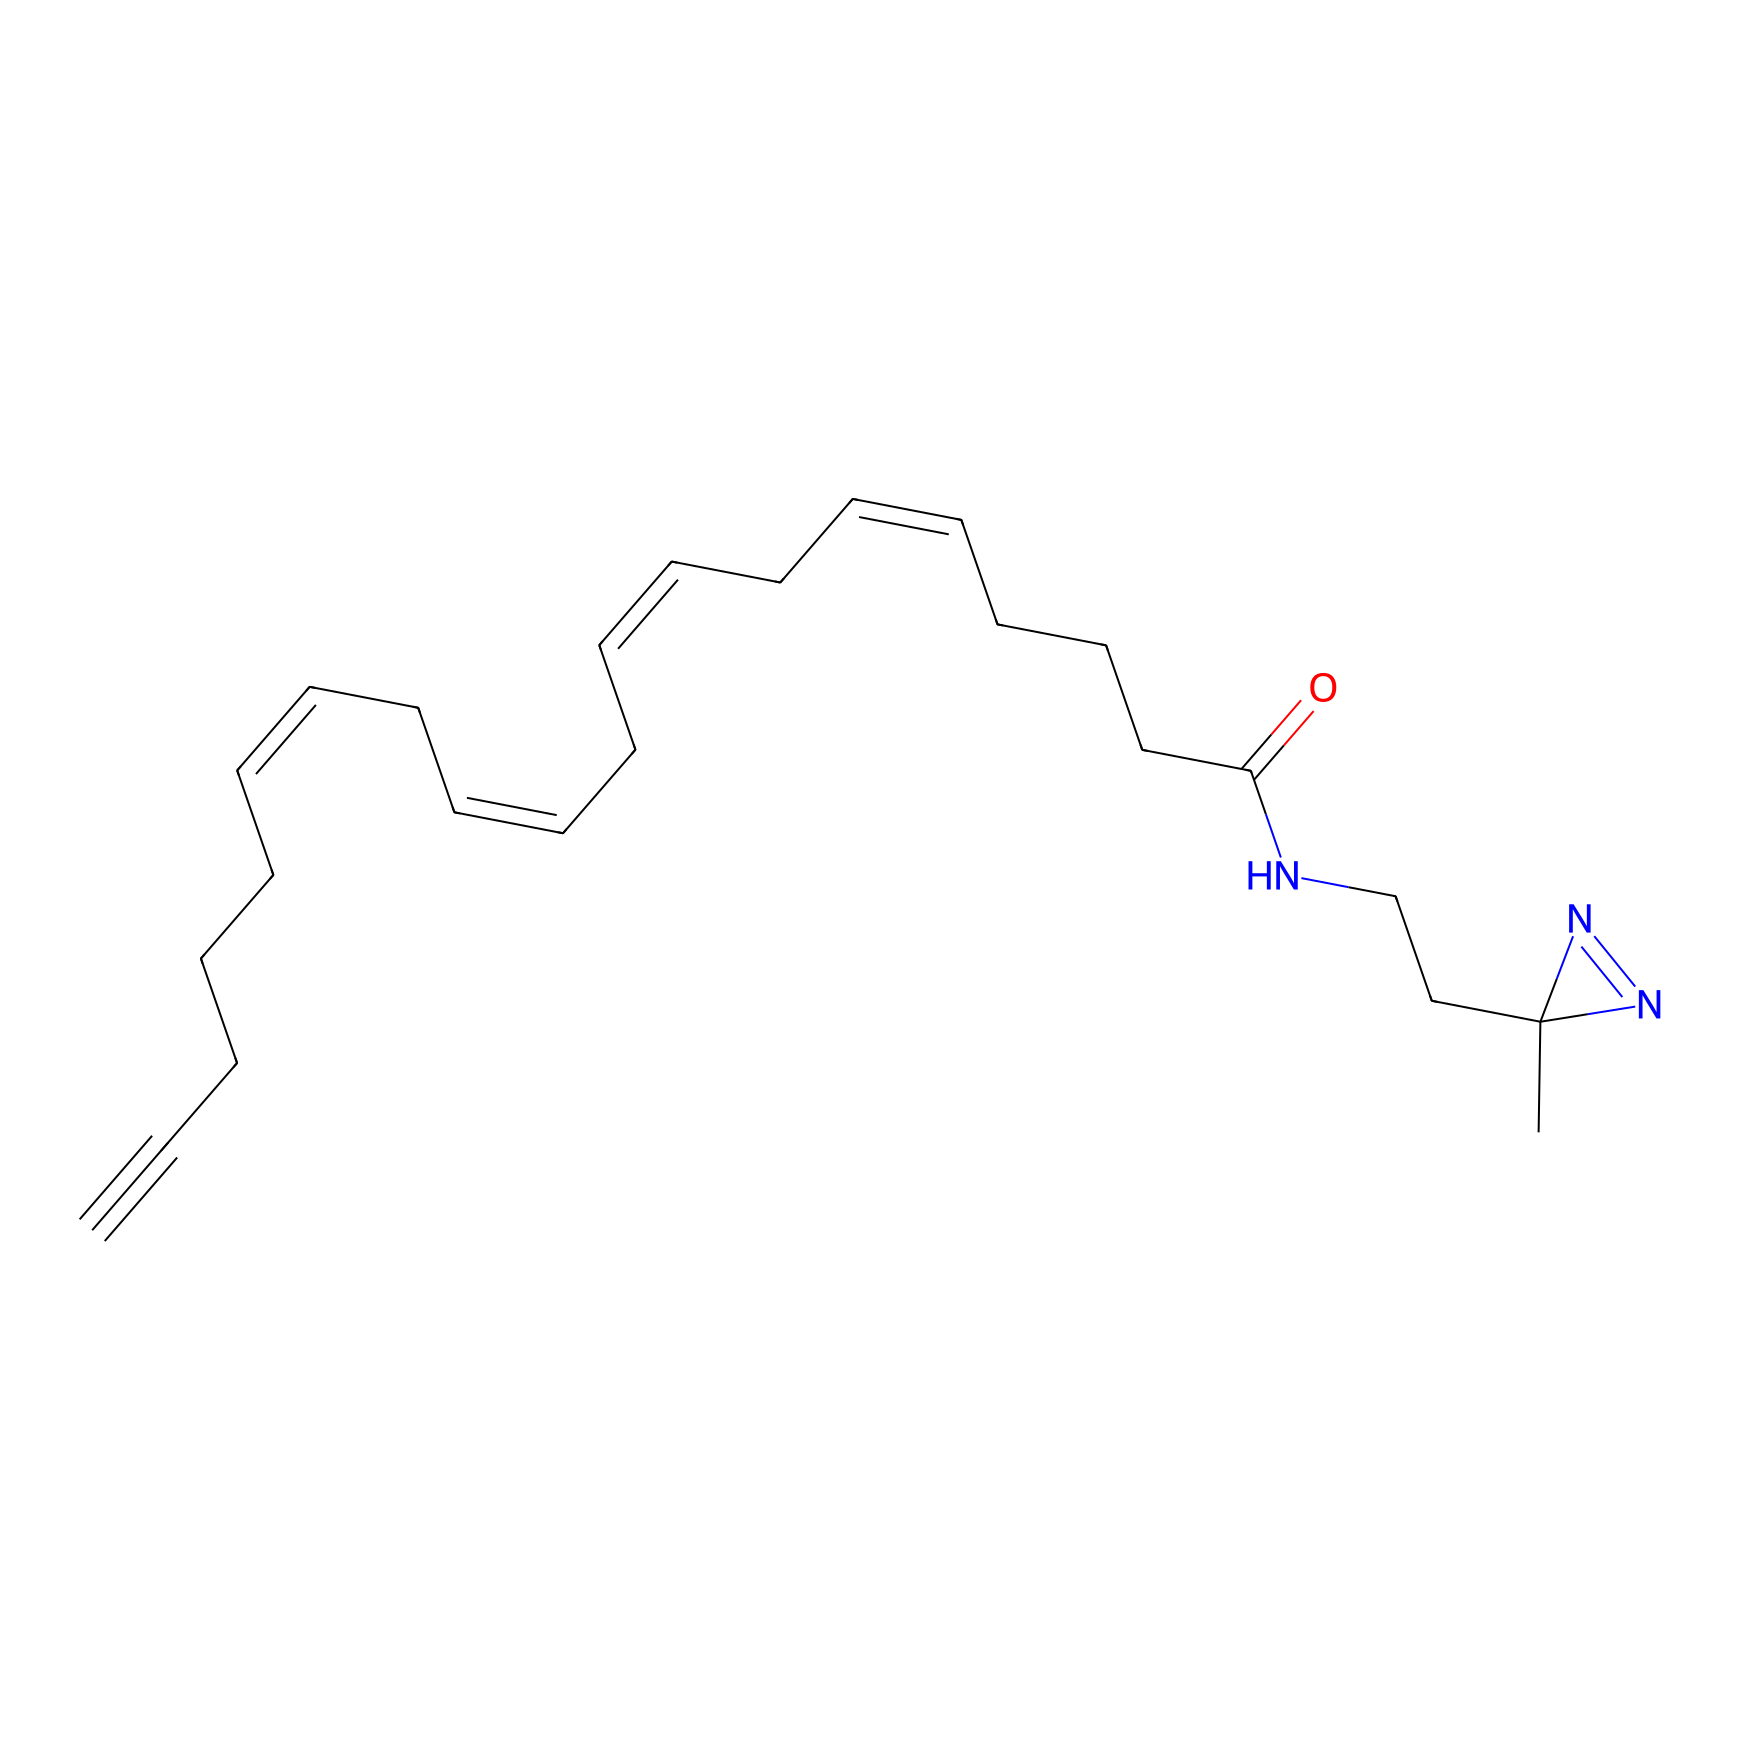
A-DA Probe Info |
 |
10 uM | Human normal cells (HEK-293T) | [1] | |
Target(s) List of this Competitor
|
2 Enzyme Competed by This
Competitor
|
||||||||||||||||||||||||
|
1 Other Competed by This
Competitor
|
||||||||||||||||||||||||
Full Information of The Labelling Profiles of This Competitor

A-DA
Quantification: Probe vs (Probe+Competitor)
|
Experiment 1 Reporting the Labelling Profiles of This Probe
|
||||
| Probe concentration | ||||
| Quantitative Method | ||||
| Competitor Name | ||||
| Competitor Concentration | ||||
| In Vitro Experiment Model |

|
|||

|
||||
| Normal | ||||
| Human normal cells (HEK-293T) | ||||
| Interaction Atlas ID |
 Download The Altas
|
|||
|
Experiment 2 Reporting the Labelling Profiles of This Probe
|
||||
| Probe concentration | ||||
| Quantitative Method | ||||
| Competitor Name | ||||
| Competitor Concentration | ||||
| In Vitro Experiment Model |

|
|||

|
||||
| Normal | ||||
| Human normal cells (HEK-293T) | ||||
| Interaction Atlas ID |
 Download The Altas
|
|||

AEA-DA
Quantification: Probe vs (Probe+Competitor)
|
Experiment 1 Reporting the Labelling Profiles of This Probe
|
||||
| Probe concentration | ||||
| Quantitative Method | ||||
| Competitor Name | ||||
| Competitor Concentration | ||||
| In Vitro Experiment Model |

|
|||

|
||||
| Normal | ||||
| Human normal cells (HEK-293T) | ||||
| Interaction Atlas ID |
 Download The Altas
|
|||
|
Experiment 2 Reporting the Labelling Profiles of This Probe
|
||||
| Probe concentration | ||||
| Quantitative Method | ||||
| Competitor Name | ||||
| Competitor Concentration | ||||
| In Vitro Experiment Model |

|
|||

|
||||
| Normal | ||||
| Human normal cells (HEK-293T) | ||||
| Interaction Atlas ID |
 Download The Altas
|
|||

OEA-DA
Quantification: Probe vs (Probe+Competitor)
|
Experiment 1 Reporting the Labelling Profiles of This Probe
|
||||
| Probe concentration | ||||
| Quantitative Method | ||||
| Competitor Name | ||||
| Competitor Concentration | ||||
| In Vitro Experiment Model |

|
|||

|
||||
| Normal | ||||
| Human normal cells (HEK-293T) | ||||
| Interaction Atlas ID |
 Download The Altas
|
|||

