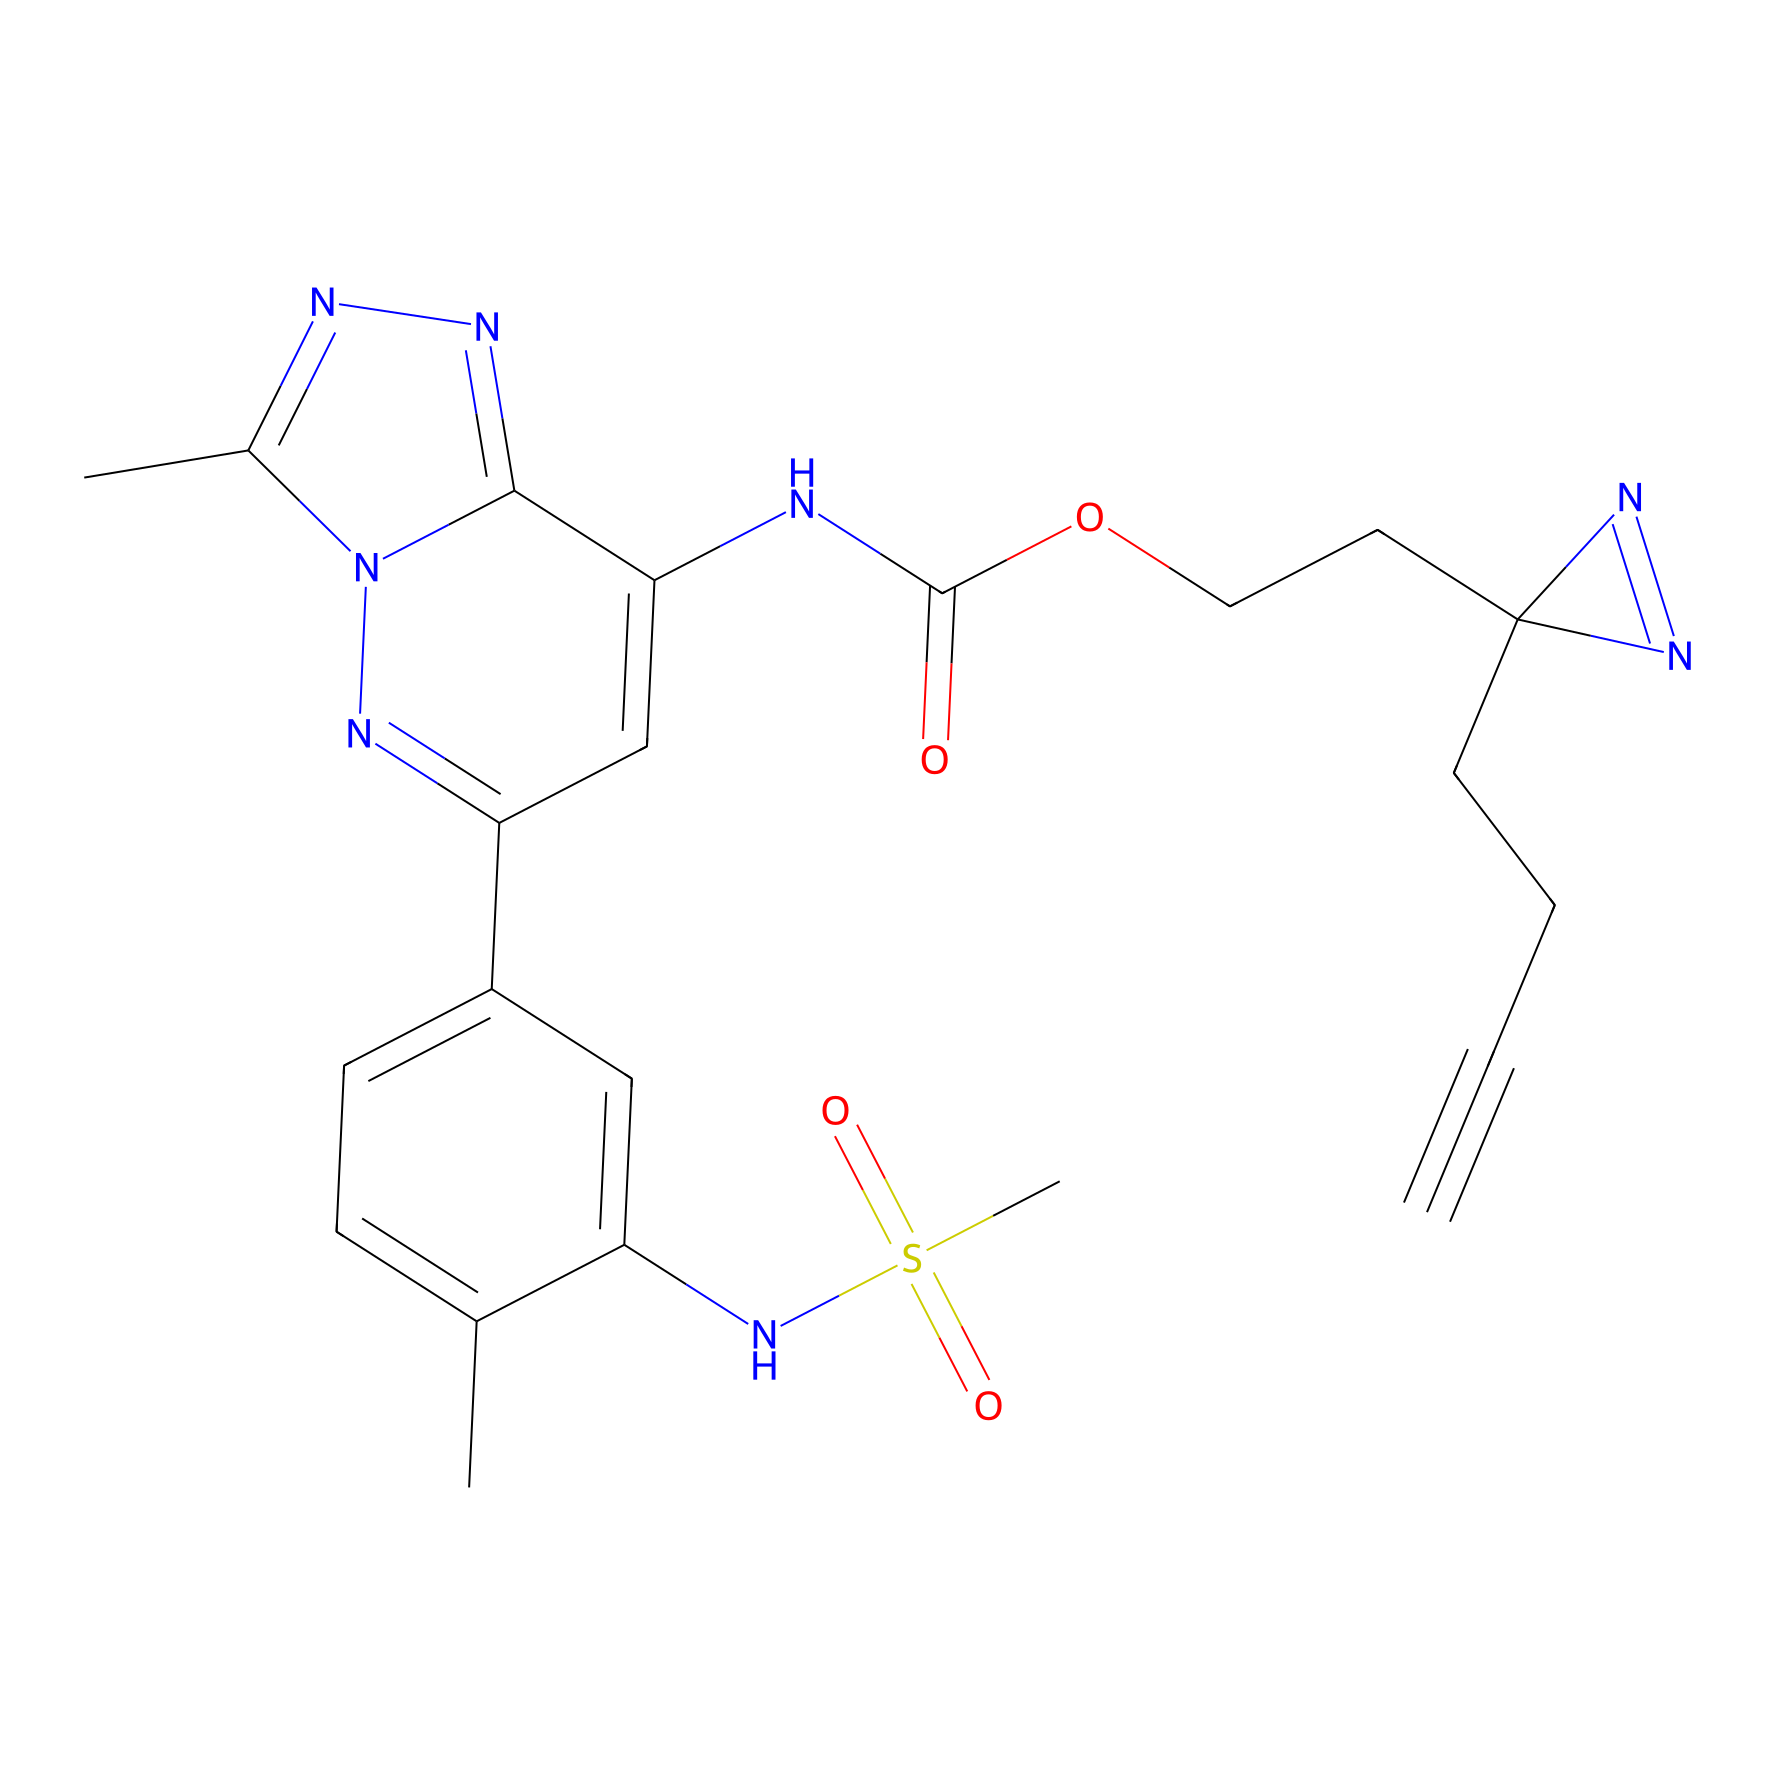
General Information of Probe

Probe ID
LDPC0213
Probe Name
photo_BS
Probe Type
PAL-AfBPP Probe
Structure
2D MOL
Ro5 Violations (Lipinski): 1 Molecular Weight (mw) 496.553
Lipid-water partition coefficient (xlogp) 3.29374
Rotatable Bond Count (rotbonds) 12
Hydrogen Bond Donor Count (hbonddonor) 2
Hydrogen Bond Acceptor Count (hbondacc) 10
Chemical Identifiers
Formula
C22H24N8O4S
Canonical SMILES
[H]C#CC([H])([H])C([H])([H])C1(C([H])([H])C([H])([H])OC(=O)N([H])c2c([H])c(-c3c([H])c([H])c(C([H])([H])[H])c(N([H])S(=O)(=O)C([H])([H])[H])c3[H])nn3c(C([H])([H])[H])nnc23)N=N1
InChI
InChI=1S/C22H24N8O4S/c1-5-6-9-22(28-29-22)10-11-34-21(31)23-19-13-18(26-30-15(3)24-25-20(19)30)16-8-7-14(2)17(12-16)27-35(4,32)33/h1,7-8,12-13,27H,6,9-11H2,2-4H3,(H,23,31)
InChIKey
VLOAAUONQRPQJG-UHFFFAOYSA-N

The Probe Interaction Atlas

Target(s) List of this Probe

2 Enzyme Labeled by This Probe
Target Name Target ID Binding Site(Ratio) Interaction ID
Epimerase family protein SDR39U1 (SDR39U1) LDTP16070 2.26  LDD0412 
Pseudouridylate synthase RPUSD2 (RPUSD2) LDTP15370 1.93  LDD0413 
------------------------------------------------------------------------------------
1 Transcription factor Labeled by This Probe
Target Name Target ID Binding Site(Ratio) Interaction ID
Peregrin (BRPF1) LDTP04683 1.60  LDD0414 
------------------------------------------------------------------------------------
5 Other Labeled by This Probe
Target Name Target ID Binding Site(Ratio) Interaction ID
Bromodomain-containing protein 2 (BRD2) LDTP03322 2.03  LDD0412 
Bromodomain-containing protein 3 (BRD3) LDTP06304 2.35  LDD0412 
Bromodomain-containing protein 4 (BRD4) LDTP01074 2.25  LDD0412 
Bromodomain-containing protein 7 (BRD7) LDTP12369 2.71  LDD0412 
Bromodomain-containing protein 9 (BRD9) LDTP12059 2.10  LDD0412 
------------------------------------------------------------------------------------

Competitor(s) Related To This Probe

Competitor ID Name Concentration Cell-system Ref
 LDCM0160  Bromosprine 10 mM Human normal cells (HEK-293T) [1]
 LDCM0161  GSK6853 10 mM Human normal cells (HEK-293T) [1]

Full Information of The Labelling Profiles of This Probe

Quantification: Probe vs (Probe+Competitor)
  
Experiment 1 Reporting the Labelling Profiles of This Probe
REF [1]
Probe concentration
10 uM
Quantitative Method
SILAC
Competitor Name
Bromosprine
Competitor Concentration
10 mM
In Vitro Experiment Model
Model Type
Living cell
Derived Tissue
Peripheral blood
Disease Model
Normal
Model Name
Human normal cells (HEK-293T)
Interaction Atlas ID
  
Experiment 2 Reporting the Labelling Profiles of This Probe
REF [1]
Probe concentration
10 uM
Quantitative Method
SILAC
Competitor Name
Bromosprine
Competitor Concentration
10 mM
In Vitro Experiment Model
Model Type
Living cell
Derived Tissue
Peripheral blood
Disease Model
Osteosarcoma [ICD-11:2B51]
Model Name
Human osteosarcoma cells (U2OS)
Interaction Atlas ID
  
Experiment 3 Reporting the Labelling Profiles of This Probe
REF [1]
Probe concentration
10 uM
Quantitative Method
SILAC
Competitor Name
GSK6853
Competitor Concentration
10 mM
In Vitro Experiment Model
Model Type
Living cell
Derived Tissue
Peripheral blood
Disease Model
Normal
Model Name
Human normal cells (HEK-293T)
Interaction Atlas ID

References

1 Chemical Proteomic Profiling of Bromodomains Enables the Wide-Spectrum Evaluation of Bromodomain Inhibitors in Living Cells. J Am Chem Soc. 2019 Jul 24;141(29):11497-11505. doi: 10.1021/jacs.9b02738. Epub 2019 Jul 9.